
Why we ran this study
Almost every published figure for the cost of a backlink traces back to one survey number. It measures what a group of SEOs said they had paid, at some point, for something. It has been quoted, rounded and re-quoted for years, and it now gets cited as though it were a market rate.
It is not a market rate. Nobody has published one, because doing it requires seeing prices across marketplaces rather than inside one, and marketplaces do not share their catalogs.
We are in an unusual position to fix that. Running a marketplace means we already maintain a research catalog of the wider market, and that catalog carries live prices from fourteen public sellers. So we did what nobody had done: pulled every priced offer we could see, normalised it, and worked out what a backlink actually costs.
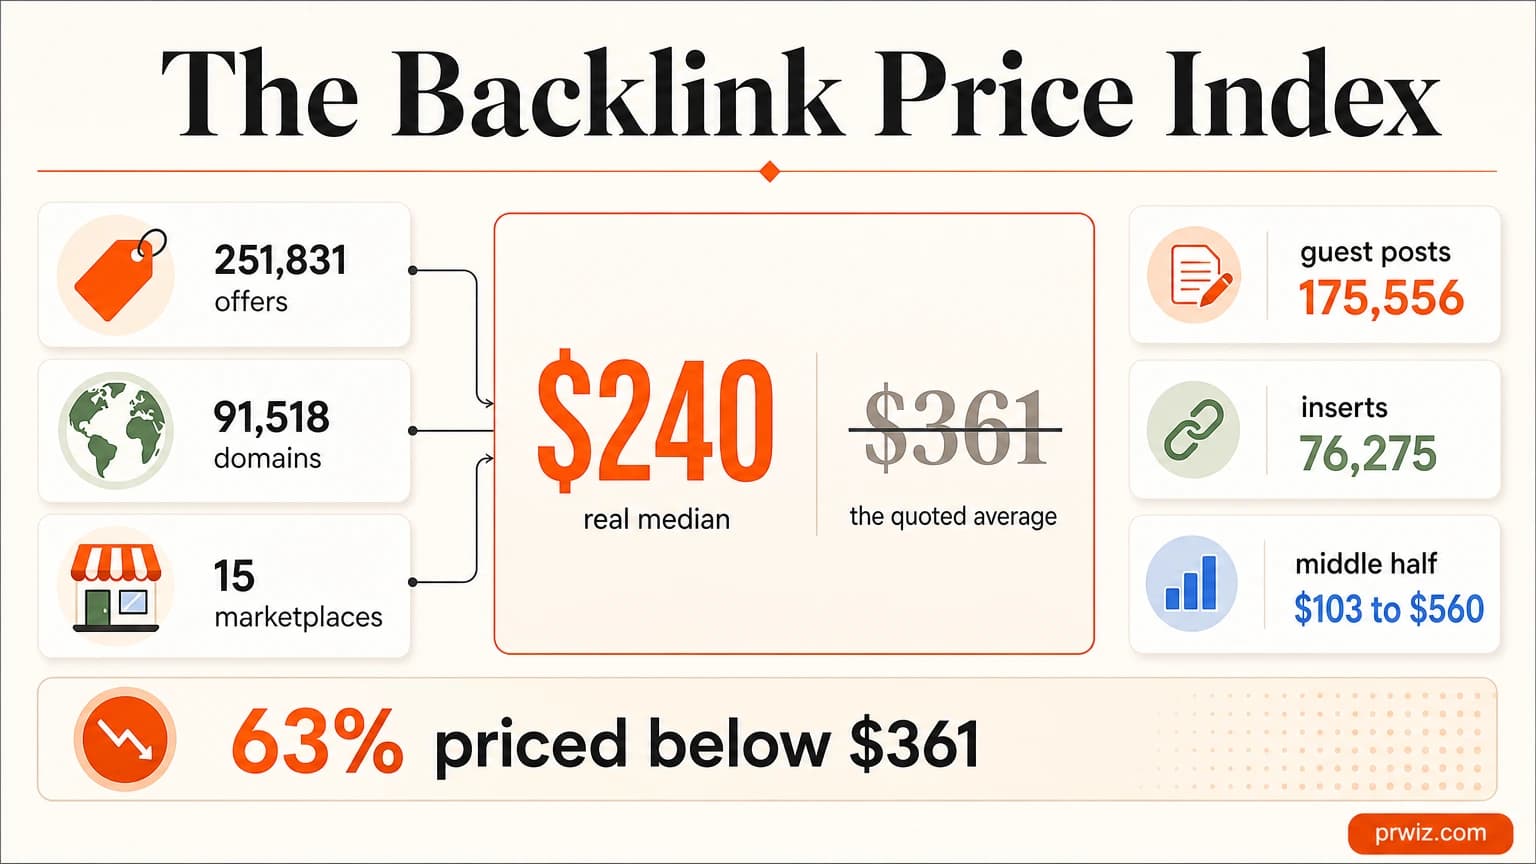
251,831 offers. 91,518 domains. 15 marketplaces. Guest posts and link insertions, priced in USD, aggregated on the day of publication. Alongside it sits our own catalog of 5,873 live listings, kept as a separate dataset and labelled as such throughout, so nothing in this report rests on the smaller sample.
Some of what came back is uncomfortable for us. Eleven marketplaces are dearer than we are and two are cheaper, and the table says so in the first section. Some of it is uncomfortable for the industry: the number everyone quotes sits above 63% of the offers actually on sale, and the metric most buyers shop on is measurably the weaker of the two available.
All of it is below, with the method at the end so you can argue with it properly.
This is a benchmark you can hold any seller to, us included. Marketplaces are named because their prices are publicly advertised. No individual publisher or domain is identified, no seller’s cost or margin appears anywhere, and there are no affiliate links to any marketplace in this report.
01. Marketplace Prices Differ By 20× For Broadly The Same Product
Start here, because it reframes everything after it. These are fourteen of the fifteen marketplaces whose live listings we can see, ranked by the median price of a placement, with our own catalog dropped into the same table so you can hold us to the same ruler. Read the caveat directly underneath before you quote any of it, because these are raw medians and catalog composition varies enormously between sellers.
Median guest post price on each marketplace, from live listings carrying a Domain Rating. Sell prices only, no cost data from any seller. linkpublishers.com is absent because its offers in this dataset are link insertions rather than guest posts.
The spread from top to bottom is twenty times, $37 to $754. Some of that is genuine pricing difference and some is catalog mix, which is exactly why the next block normalises it before anybody draws a conclusion.
Our own row is in this table because the whole point is to be measured on the same ruler, and our listings are also inside every index figure elsewhere in this report. We are 3.2% of the pool, which moves the index median by six dollars, and it moves it down. The full sensitivity is in the methodology.
Two entries need context before anybody quotes them out of it. linksmanagement.com shows a $37 median inside a $32 to $41 range, which is a flat-rate product rather than per-site pricing, so it is not a like-for-like comparison. prnews.io carries a $1,427 mean against a $343 median, a four-times gap, which is exactly what a press-release marketplace looks like when national outlets sit in the tail.
PRWiz is twelfth of fourteen on raw price, and eleventh on like-for-like
Our median of $138 is 43% below the $240 index median. Two sellers price below us on raw medians and three do on like-for-like, so we are not the cheapest and are not trying to be.
What this table cannot show is the part that decides whether a link was worth buying: whether the site has readers, whether the placement survives twelve months, and whether you saw the domain before your card was charged. That is the ground we would rather compete on.
The problem with comparing raw medians
Those medians are not like-for-like, and it would be dishonest to present them as though they were. Catalog composition differs enormously. linksmanagement.com carries 1,808 offers and serpzilla.com carries 13,749. More importantly, the mix of sites differs: a marketplace stocked with small low-traffic blogs will post a low median that describes its inventory rather than its pricing.
So we normalised it. Below, every marketplace is measured on the same slice of the market: the same DR band, the same traffic band, the same product. If a seller only looks cheap because its catalog is weaker, this table exposes it.
| # | Marketplace | All offersunadjusted median | DR 30 to 49median | DR 50 to 69median | Traffic 5K to 25Kmedian | Like for like ↓DR 30-49 & 5K-25K traffic |
|---|---|---|---|---|---|---|
| 1 | backlinked.com | $754 | $695 | $932 | $765 | $728 |
| 2 | bazoom.com | $439 | $445 | $726 | $474 | $451 |
| 3 | linksasaservice.com | $396 | $398 | $521 | $423 | $439 |
| 4 | serpzilla.com | $314 | $353 | $440 | $390 | $393 |
| 5 | meup.com | $340 | $316 | $450 | $347 | $335 |
| 6 | prnews.io | $343 | $288 | $371 | $354 | $301 |
| 7 | collaborator.pro | $169 | $194 | $239 | $206 | $219 |
| 8 | whitepress.com | $174 | $189 | $239 | $197 | $217 |
| 9 | prposting.com | $182 | $193 | $289 | $208 | $193 |
| 10 | ereferer.com | $141 | $142 | $260 | $174 | $192 |
| 11 | PRWiz | $138 | $133 | $154 | $180 | $185 |
| 12 | adsy.com | $140 | $149 | $150 | $165 | $174 |
| 13 | guestpostlinks.net | $96 | $103 | $96 | $150 | $158 |
| 14 | linksmanagement.com | $37 | $37 | $39 | $37 | $37 |
Sorted by the final column, not the first. That is the point of the table: the ranking you get on like-for-like inventory is not the ranking you get on raw medians. On raw price PRWiz is twelfth of fourteen; here we are eleventh. The PRWiz row is our own catalog, computed with the identical filters. Every column is a median of the same product on the same slice of inventory, and the final column holds DR and traffic constant so what remains is pricing policy rather than catalog mix. linkpublishers.com is absent because its offers in our dataset are link insertions rather than guest posts.
Three things fall out of that, and only one of them is comfortable for us.
The cheap end is less cheap than it looks. guestpostlinks.net posts a $96 unadjusted median and a $158 like-for-like median, a 65% jump. ereferer.com moves from $141 to $192. Their headline numbers are partly a description of what they stock, not what they charge.
The expensive end is genuinely expensive. backlinked.com barely moves, $754 to $728. It is not carrying a premium catalog and charging accordingly, it is charging a premium for the same sites everyone else sells.
The honest spread is narrower than the headline. Setting aside linksmanagement.com, whose flat-rate model makes it a different product, the raw range runs 7.9 times ($96 to $754). On like-for-like inventory it narrows to 4.6 times ($158 to $728). Still enormous for an identical product, but the twenty-fold figure in the first table overstates the pricing gap and understates the quality gap.
Our own number moves the other way, and we are printing that rather than hiding it: $138 unadjusted rises to $185 like-for-like across 412 matching listings. Our catalog skews toward smaller sites, so normalising to a mid-authority, mid-traffic slice selects our more expensive end. On a like-for-like basis we are cheaper than ten of the fourteen, not eleven of them.
Niche pricing, on a fixed slice
The same correction applies to niche comparisons. Below, every category is measured on DR 30 to 49 with 5,000 to 25,000 monthly visitors, so category is the only thing varying.
Index-wide, all 15 marketplaces including PRWiz, on a fixed slice of DR 30 to 49 with 5,000 to 25,000 monthly SEMrush visitors. Categories with fewer than 200 offers inside the slice are excluded. Comparing against the unadjusted chart in section 07 shows how much of a category’s apparent price is really its inventory mix.
Notice how the order changes once inventory is held constant. Parenting and family climbs from eighth to third at $410, because its cheap end is full of tiny blogs that drag the unadjusted figure down. Travel overtakes sports. News and media falls from $240 to $216, which tells you its headline median was propped up by a handful of very large outlets rather than by typical inventory.
If you take one methodological point from this report, take that one. A median without a controlled comparison group tells you about a catalog, not about a price. That applies to every pricing table in this industry, including the ones we published in section one.
02. The Same Backlink Costs 30% More Depending On Where You Buy It
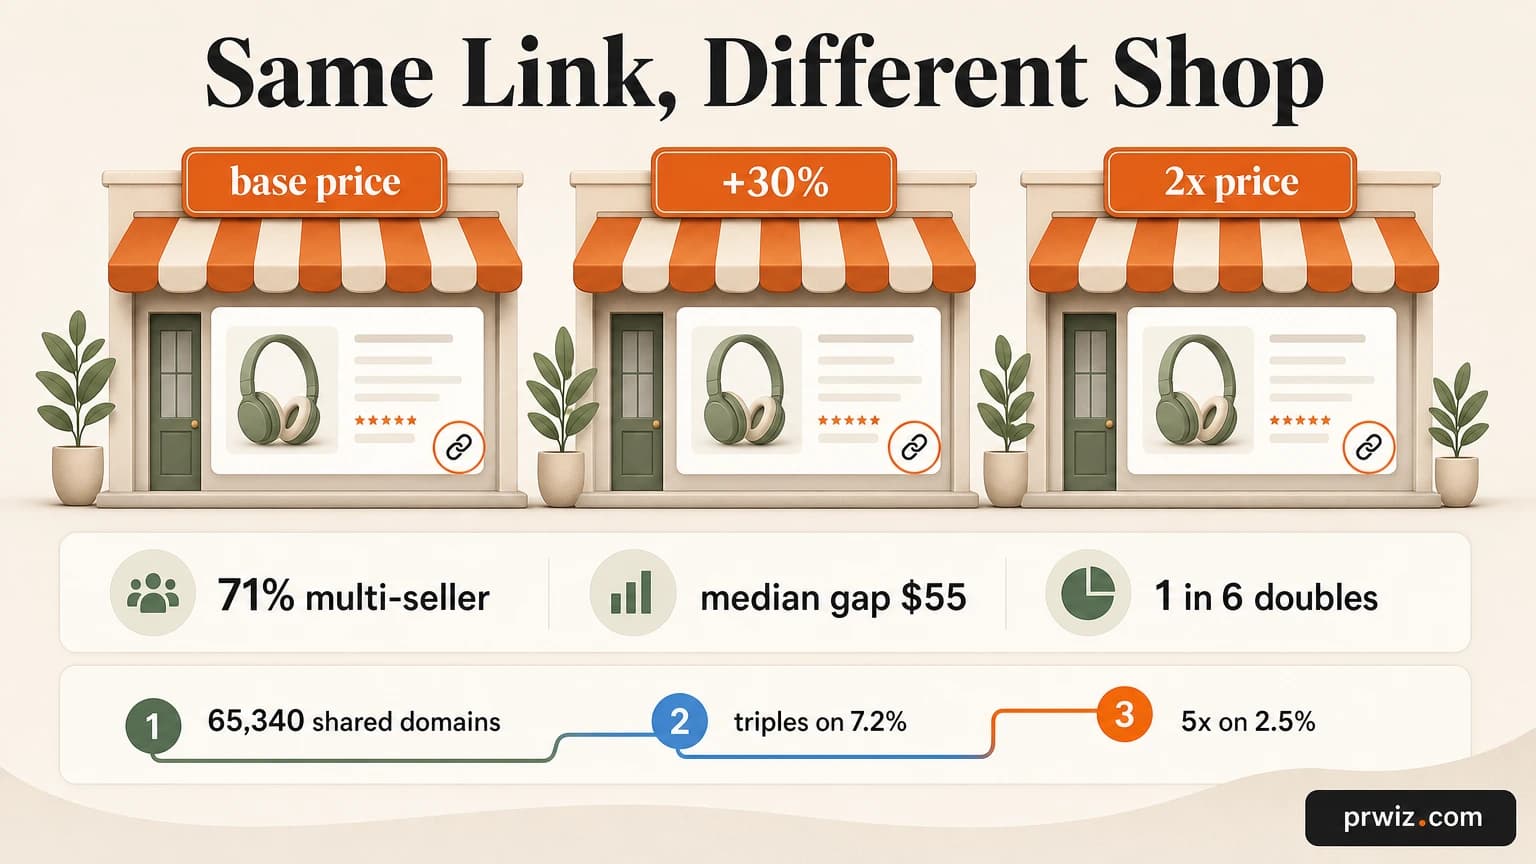
The same publisher is typically sold by more than one marketplace, at a median price gap of 30%. Here is the finding that surprised me most, and it is only visible if you can see across marketplaces rather than inside one.
Of the 91,518 domains in this dataset, 65,340 are sold by two or more marketplaces. That is 71% of the market. The same publisher, the same guest post slot, listed in several storefronts at the same time under different prices.
The median price gap on a shared domain is $55, or 30% on top of the cheaper listing. On 7.2% of shared domains the price triples, and on 2.5% it is five times or more. Same site. Same link. Different logo above the checkout.
None of that is fraud. Marketplaces negotiate their own rates with publishers, carry different margins, and resell each other’s inventory. It is simply what a market with no published prices does to the people buying in it.
Never buy a domain without checking a second source
If you place links at any volume, the cheapest research you will ever do is opening two marketplaces before you buy. On one placement in six that habit is worth 50% of the price, and on one in forty it is worth 80%.
This is also why we publish medians rather than hiding behind “contact us for pricing”. A market this dispersed only rewards opacity, and we would rather be checked.
03. The Index Median Is $240, And The Quoted Average Sits Above 63% Of Real Offers
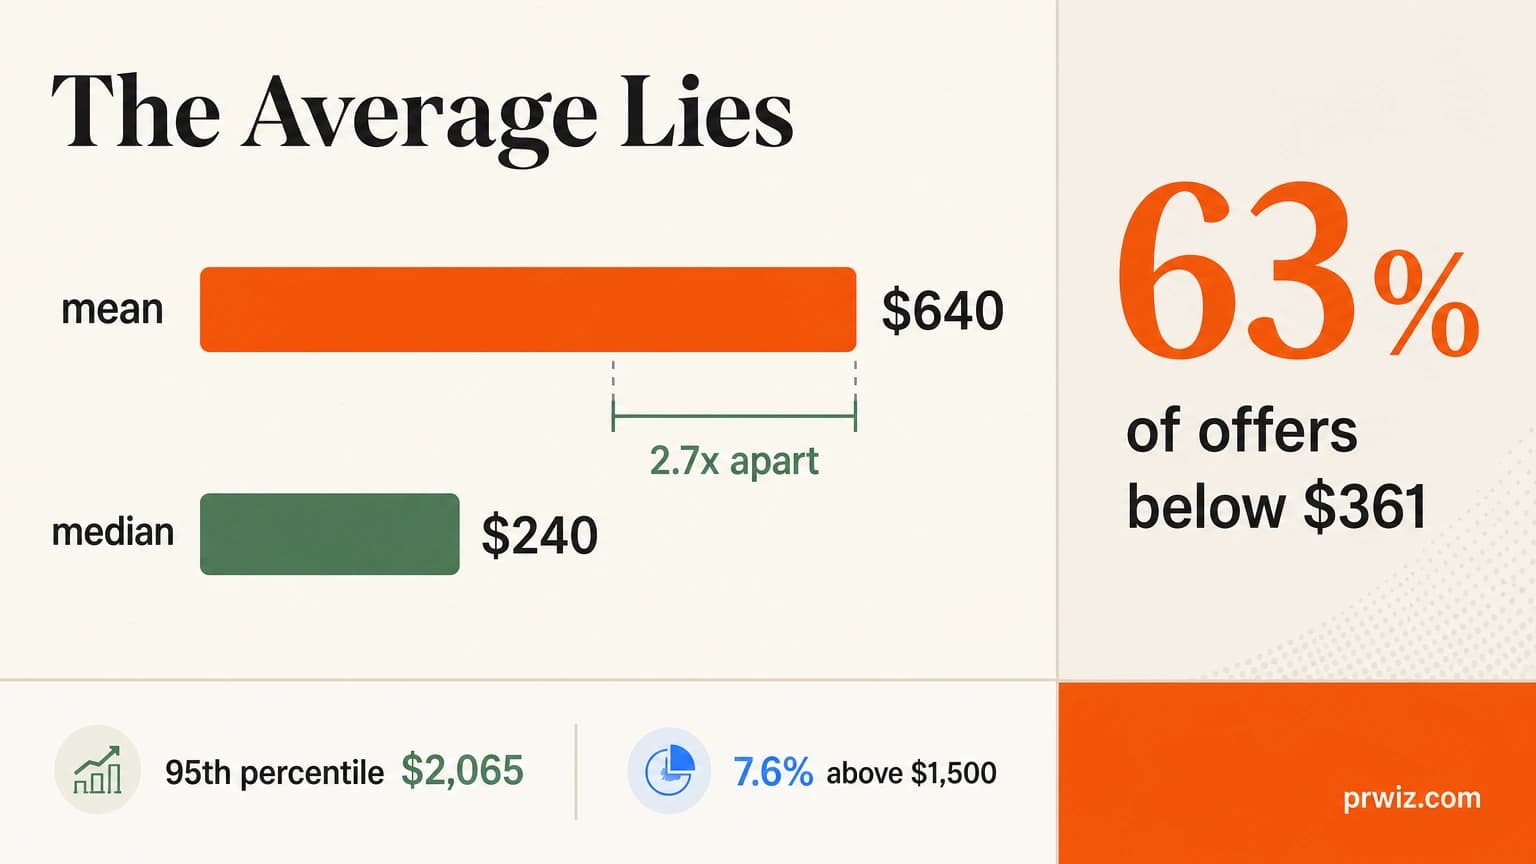
A backlink costs a median of $240 in 2026. Across all 175,556 guest post offers in this dataset the median price is $240. The number the industry has been quoting for years is $361, and 63.1% of real offers are priced below it. It is not a typical price, it is closer to the top third of one.
Two things produce that gap, and once you see them you cannot unsee them.
First, everybody reports a mean. Backlink prices are violently right-skewed. The index mean is $640 against a median of $240, a ratio of 2.7 to 1, because a small number of very expensive placements drag the average a long way up. The 95th percentile in this dataset is $2,065. A handful of listings like that move a mean and move a median not at all.
Second, most quoted figures are agency retail. When an agency reports paying $361 a link, that usually includes prospecting, outreach labour, content, account management and margin. It is a real number for a real service. It is not the price of a placement, and comparing the two is comparing a restaurant bill to a grocery receipt.
Our own catalog shows the same skew in miniature: a mean of $190 against a median of $138, with 91% of listings below $361. Same distortion, smaller catalog.
All 175,556 priced guest post offers across 15 marketplaces. The distribution is almost flat between $100 and $749, then carries a long tail: 7.6% of offers are priced above $1,500.
There is no tidy cluster here. Roughly a fifth of the market sits in each of the $100 to $199, $200 to $349 and $350 to $749 bands, which is why any single “average” is meaningless. 63.1% of offers are priced below $361, and 7.6% are above $1,500, and that tail is doing all the damage to the published averages.
Inside our own catalog the curve is tighter: 70% of listings below $200 and 91% below $361, because we carry far fewer four-figure placements.
A mean tells you what the loudest prices were. A median tells you what the market is.
04. Authority Multiplies The Price By 3.5, But Only From A Low Base
This is the table everyone comes for. Index-wide, across 175,556 guest post offers, here is what authority actually does to a price.
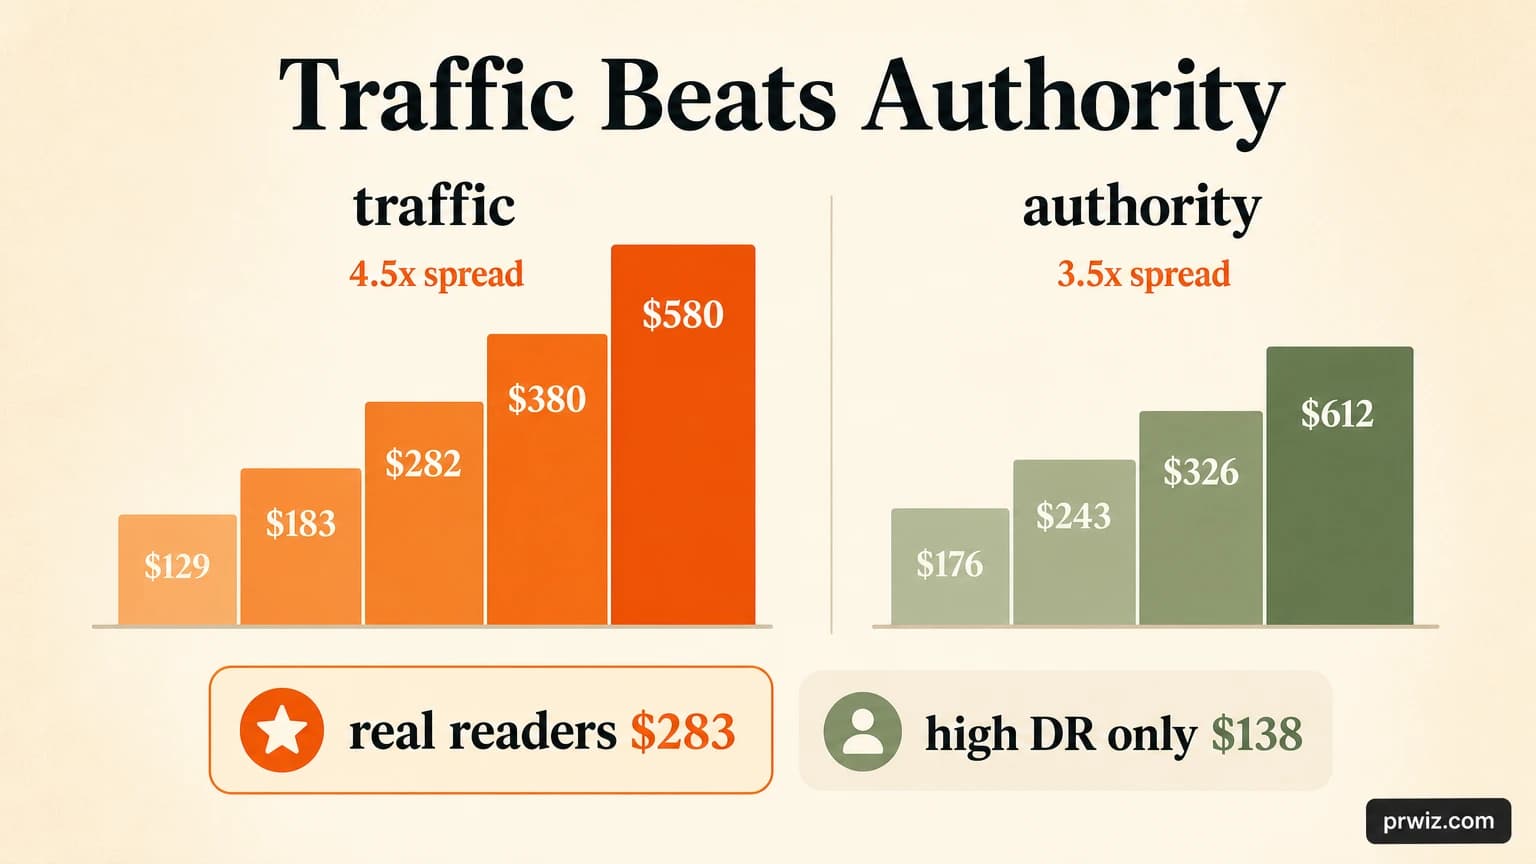
All 175,556 priced guest post offers carrying a Domain Rating, across 15 marketplaces. The four bands sum to the full sample, because offers with no DR are excluded from the entire study. Interquartile ranges: $80–$357, $111–$518, $130–$798 and $210–$1,526. Bottom to top, the median spread is 3.5 times.
Going from the bottom band to the top multiplies the median by 3.5, from $176 to $612. That is a real premium, and it is a long way from the tenfold jump implied when somebody quotes $2,000 for a DR 70 placement. At the 25th percentile a DR 70+ placement is available for $210, which is cheaper than the 75th percentile of the DR 1 to 29 band.
The ranges matter more than the medians here. At DR 70+ the middle half runs $210 to $1,526, a sevenfold spread inside a single authority band. Authority alone cannot explain a price, which is exactly what the next section is about.
The same shape, compressed
On PRWiz the four bands run $100, $133, $154 and $200, a spread of 2.0 times rather than 3.5. We carry very few four-figure placements, so the curve is flatter and the top band sits far below the market’s.
Whether that is a feature depends on what you need. If you want a $1,500 DR 78 news placement, we are not the right shop, and the table in section one tells you where to look.
05. Traffic Predicts Price Better Than Domain Rating Does
This is the finding I did not expect, and it is the most useful thing on this page.
I ran the same medians against organic traffic bands instead of authority bands and the spread came out wider.
Our market crawl excluded domains showing under 500 SEMrush visitors before pricing was collected. The 9,308 offers sitting in the under-500 band are sites whose SEMrush estimate has slipped below that floor since they were first collected.
So that first bar is a partial and upward-biased sample of genuinely tiny sites, and the true index median at the very bottom of the traffic range is almost certainly lower than $129. Every band from 500 upward is unaffected. If you are quoting one number from this chart, quote the 100K+ band or the overall spread, not the floor.
Market dataset, 15 marketplaces. SEMrush traffic covers 175,545 of the 175,556 priced guest post offers, so this is effectively the full dataset. Median price rises 4.5 times from the lowest band to the highest. One caveat on the first bar, explained directly below.
Our own catalog runs the same curve at a lower level and a shallower slope: $91, $133, $180, $229 and $271 across the same five bands, a spread of 3.0 times.
Across the index, traffic spreads price 4.5 times while authority spreads it 3.5 times. Inside our own catalog the same comparison is 3.0 against 2.0. Two datasets, two scales, same direction. Here they are side by side.
Across 15 marketplaces, price spreads 4.5 times from the lowest traffic band to the highest, against 3.5 times across Domain Rating bands. The finding holds across 175,545 offers, not just inside one catalog.
Then I crossed the two signals inside our own data, and the result is the single clearest number in this report.
Read that twice. Across the whole market, a site with weak authority and real readers costs more than double a site with strong authority and nobody visiting. $283 against $138, measured on 11,125 offers.
Our own catalog shows the same direction more gently, at $154 against $120. The market has already priced in what a lot of buyers have not: a Domain Rating is a model output, and an audience is a fact.
Filter on traffic first. Use authority as the tiebreaker.
If you sort a marketplace by DR and buy from the top of the list, you will routinely pay a premium for pages nobody reads. Our cheapest inventory, at a median of $91, is concentrated in the under-500-visitors band, and that is exactly where the high-DR-no-traffic sites cluster.
Every listing in the publisher database shows traffic next to authority for this reason. You cannot compare the two signals unless somebody puts them side by side before you pay.
A high Domain Rating with no readers is a link farm wearing a costume, and the market already prices it like one.
06. Link Insertions Cost 10% More Than Guest Posts, Not Less
People compare a $138 guest post to a $349 press release and conclude one is a rip-off. They are different things with different economics, so here they are side by side.
| Placement type | Median | Middle half | What the money buys |
|---|---|---|---|
| Guest post | $138 | $87 to $221 | A new article written, pitched and published, plus the placement |
| Link insertion | $108 | $82 to $154 | A link added to an article that already exists and already ranks |
| Press distribution | $349 | $349 to $599 per release | One release syndicated across 560+ outlets, priced per release |
| Digital PR | Custom | campaign scoped | Story development, journalist outreach and earned coverage |
On PRWiz, insertions run about 22% below guest posts, and that gap is the article you are not commissioning.
Index-wide it goes the other way, and this one genuinely caught me out. Across 15 marketplaces the median link insert is $263 against $240 for a guest post, so insertions cost 10% more, not less. The reason is supply: 175,556 guest post offers exist against only 76,275 insert offers, because most publishers will happily run a new article and far fewer will let you touch a page that already ranks. Scarcity beats production cost.
The practical read is that an insertion is worth the premium when the host page is a strong topical match and already pulls traffic, and worth nothing when it is not. You are buying into somebody else’s page, so relevance depends on what they already wrote rather than a brief you set.
07. Finance Links Cost Nearly Double What Technology Links Cost
Every guide in this space warns about a premium on gambling, CBD and crypto. Index-wide, the expensive categories sit somewhere else entirely.
Index-wide medians by primary category across all 15 marketplaces, restricted to categories carrying at least 2,000 priced offers. General-interest sites, excluded here for readability, sit far below everything at a median of $59 across 3,613 offers.
Finance at $404 is nearly double Technology at $210. Automotive, sports and travel all clear $330. The driver is not risk, it is commercial value: a finance publisher knows what a mortgage lead is worth and prices for it, and an automotive site knows the same about a dealership. Technology has enormous supply, which is why it sits near the bottom despite every SaaS founder wanting tech links.
News and media is the deepest category in the index by a wide margin at 37,751 offers, and it prices mid-table at $240. If your story can plausibly live in a news context, that is where the inventory is.
Our own listings sit inside these medians and pull them down slightly, since PRWiz prices below the index across every category. On our catalog alone the same ranking holds at roughly half the level: sports $214, finance $200, technology $112.
08. Regulated Niches Have Cheaper Sites And 47% To 64% Dearer Placements
The regulated-niche story is more interesting than either side of the usual argument, because both halves of it are true at once.
Split the catalog by whether a site accepts regulated content at all, and the sites that say yes are cheaper on their standard rate.
That looks backwards until you think about who is saying yes. Sites willing to publish anything tend to be less selective across the board and they price to move volume. Selectivity is expensive to maintain, so the sites that refuse the work charge more for the work they do take.
Now look at what those same permissive sites charge for the regulated placement itself, and the premium reappears with force.
| Vertical | Listings offering it | Median regulated price | Same sites, standard rate | Premium |
|---|---|---|---|---|
| Adult | 1,116 | $169 | $103 | +64% |
| Casino and gambling | 2,057 | $177 | $115 | +55% |
| CBD and cannabis | 1,974 | $169 | $115 | +52% |
| Crypto and Web3 | 2,233 | $169 | $115 | +46% |
So both things are true. The sites are cheaper and the placements are dearer, and the two roughly cancel out: a casino placement at $177 lands close to what a mainstream site charges for ordinary content anyway.
Which means the real cost of a regulated niche is not the surcharge. It is scarcity at the quality end. The best sites decline the vertical entirely, so you are competing over a smaller pool, and the premium you feel is mostly the feeling of running out of good options. I wrote the long version of that market in the casino link building playbook.
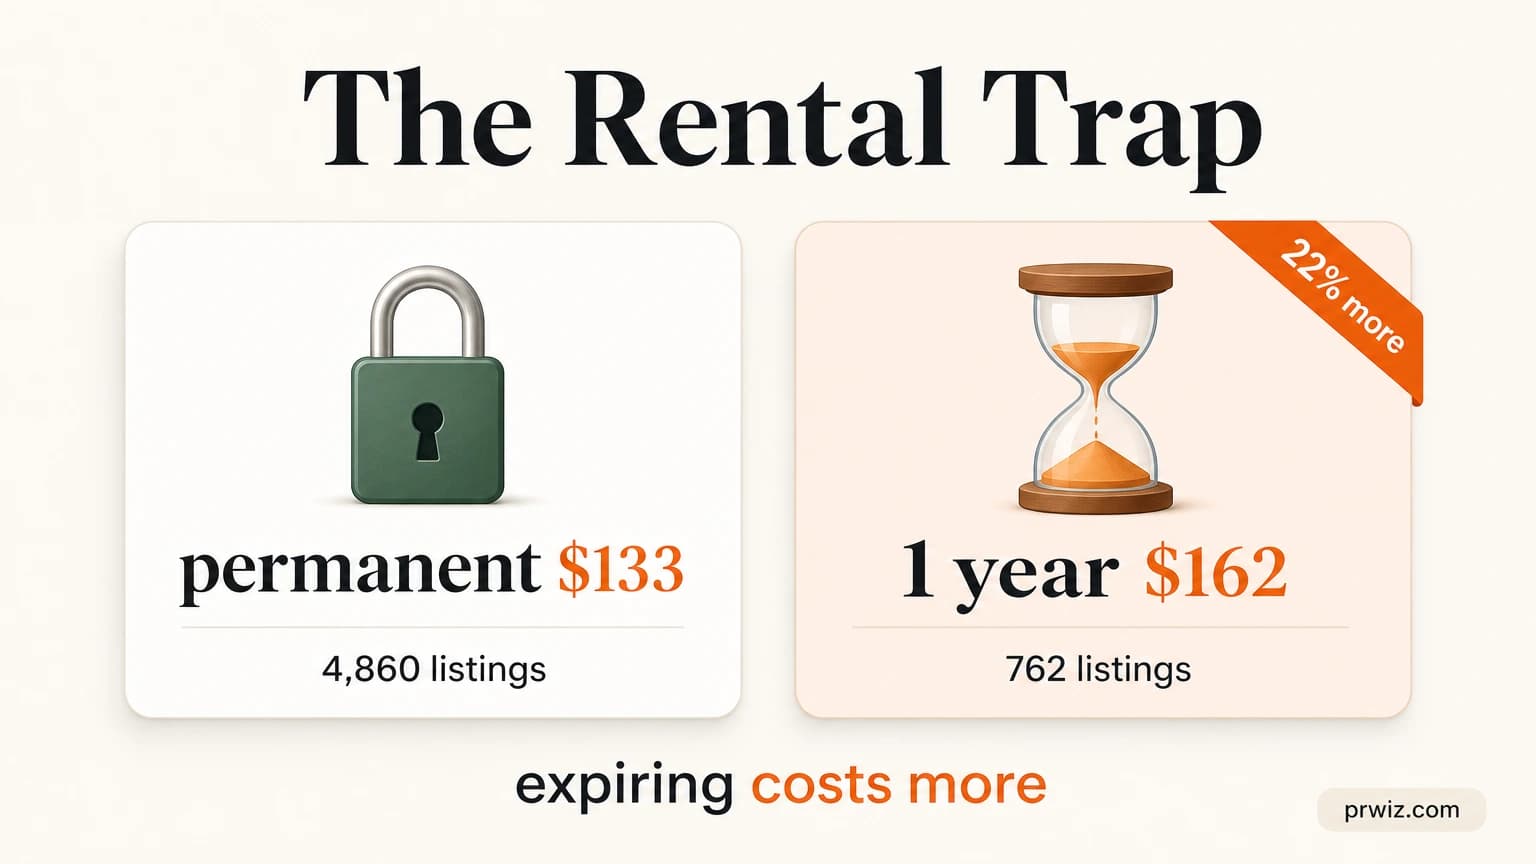
09. Permanent Links Cost 22% Less Than Rented Ones
This is the finding I would most like buyers to take away, because it costs people money every week and almost nobody checks for it.
A one-year placement is a lease. When it lapses you either pay again or you lose the link and whatever ranking it was holding up. Paying 22% more for the version with an expiry date is a bad trade in nearly every scenario, and it happens constantly because the validity window sits in the terms rather than next to the price.
Check it before you compare anything. A $120 permanent link and a $120 annual link are not the same purchase, they are not even the same category of purchase.
10. German Audiences Cost 3.7× What French Audiences Cost
One more cut, because it decides budgets on every international campaign.
Index-wide medians by the country supplying most of a site’s SEMrush organic traffic, across all 15 marketplaces, restricted to countries with at least 2,500 priced offers.
Germany is the most expensive market in the index, at $631, which is 3.7 times France at $171 and well above the United States at $238. The pattern is not language and it is not GDP, it is supply. The US has 28,958 offers competing on price. Germany has 10,309, and German publishers have historically been far more restrictive about paid placement, so the ones who do sell can charge for it.
The practical consequence for anyone running European campaigns is that a flat per-link budget across markets will quietly buy you close to four times as much in France as it does in Germany. Budget per market, not per link.
11. Cheap Links Are The Most Expensive Thing In This Market
Everything above is a price. None of it is a value. Those are different questions and confusing them is how people lose money in this market.
When you buy a placement you are buying four things: a site real people read, an editor who will not publish anything for anybody, a page that stays live and indexed, and a link that still exists in a year. A $40 link usually fails at least two of them. The problem is not that it does nothing. The problem is that it does nothing and you now own a link from a site that also points at thirty casinos with exact-match commercial anchors.
The genuinely expensive outcome is never the wasted $40. It is the cleanup: a profile you have to disavow, a client report you have to explain, and months of ranking work you have to redo. Measured that way, the cheapest links in this market are routinely the most costly things you can buy.
The reverse is just as true, and I will say it even though it argues against charging more. A $600 quote is not evidence of quality. I have watched sellers price purely on Domain Rating and charge triple for a site with a thousand monthly visitors, which our own cross-tab in section five shows the market does not actually support. Price tells you what somebody is asking. Traffic, spam signals and the outbound link pattern tell you whether they should be.
Cheap links are not expensive because of what you spend. They are expensive because of what you have to undo.
12. Six Checks That Tell You Whether A Price Is Fair
Six checks, in the order I run them.
Anchor to the band, not to the quote
Find the DR band and the traffic band, then compare against the medians above. Anything past the 75th percentile needs a reason you can say out loud without wincing.
Check traffic before authority
Real organic visitors and a flat or rising trend. A DR 60 site with 200 visitors a month is priced on a vanity metric, and section five shows the wider market agrees with me.
Read the outbound links on a recent post
If the page already points at a dozen unrelated commercial sites, you are buying a slot in a scheme rather than a placement in a publication.
Confirm the validity window first
Permanent against one year is not the same product, and our data says the rental is usually the dearer of the two, which is the opposite of what most people assume.
Ask what happens if it disappears
A seller who has not thought about this has told you something important. Monitoring, a replacement policy and a named window are the answer you want to hear.
Refuse to buy anything you cannot see
If the domain stays hidden until payment clears, the price is irrelevant, because you have no way to judge what it actually buys.
13. What A Monthly Link Building Budget Actually Buys
Every number above is per placement. Here is what they add up to, because “what should I spend” is the question underneath “what does a link cost”.
| Monthly budget | At DR 30 to 49 | At DR 50 to 69 | What that pace looks like |
|---|---|---|---|
| $500 | 3 to 4 links | 3 links | A small site or a single service page, built slowly and consistently |
| $1,500 | 11 links | 9 links | A serious local or niche campaign with room to test two or three angles |
| $5,000 | 37 links | 32 links | A competitive commercial vertical, or one agency covering several clients |
| $10,000 | 75 links | 64 links | Enterprise pace, usually mixed with digital PR rather than spent purely on placements |
Link counts are computed at PRWiz medians for those bands, $133 and $154, because that is what you would pay here. At the index medians of $243 and $326, roughly halve them.
Two things worth saying about that table, both of which cost us money to say.
The first is that more links is rarely the right answer. Four well-chosen placements a month on sites your customers actually read will out-perform twenty cheap ones almost every time, and the twenty will leave you with a profile you have to explain later. If your budget only covers three good links, buy three good links.
The second is that consistency beats size. A site that adds four links every month for six months looks natural and compounds. A site that adds twenty-four in one month and then nothing looks like exactly what it is. Spread it.
If you are spending under $300 a month, spend it on content instead
At our own median, $300 buys two links. Two links will not move a page that has nothing worth ranking on it. Fix the page, build the topical coverage, then come back and buy links pointing at something that deserves them.
I would rather tell you that now than take $300 a month for six months and have you conclude that link building does not work.
Methodology
You should not take a pricing benchmark on faith, so here is exactly what sits behind every number above.
Two datasets, kept separate
- The index. 251,831 priced offers across 91,518 domains, aggregated from the live listings of 15 marketplaces including our own: backlinked.com, bazoom.com, serpzilla.com, linksasaservice.com, prnews.io, meup.com, prposting.com, whitepress.com, collaborator.pro, adsy.com, linkpublishers.com, ereferer.com, guestpostlinks.net, linksmanagement.com and PRWiz. Of those offers, 175,556 are guest posts and 76,275 are link inserts.
- Our own slice. 5,873 live listings on our own marketplace, of which 5,692 carry a guest post price. Every one was purchasable on the day of publication.
- Anywhere a figure could be mistaken for the other dataset, the text says which one it came from. Every chart and table header names its dataset. Charts labelled index-wide use all 15 marketplaces, PRWiz included. The one place the two appear side by side is the stratified table in section 01, where our row is computed with identical filters so it is directly comparable.
How the numbers were computed
- Prices: sell prices only, meaning what a buyer would pay. No seller’s cost or margin appears here, ours included, and none of it is reverse-engineerable from anything on this page.
- Statistic: medians and quartiles rather than averages, because the distribution is right-skewed and a mean flatters the market by 2.7 times.
- Traffic provider: SEMrush, on both sides of the dataset. It is the only estimator present across the whole crawl and our own catalog, covering 175,545 of 175,556 priced guest post offers. Banded rather than treated as continuous, because estimate precision does not justify more granularity. One thing to know if you verify this yourself: the PRWiz marketplace defaults its traffic column to Ahrefs, so switch the traffic toggle to SEMrush before comparing against any band in this report. Ahrefs reads higher on small sites and you will get different numbers on the same listings.
- Domain Rating: Ahrefs DR. Offers on domains with no DR are excluded from the entire study, 4,032 of them, all clustered at the very cheap end. Including them would drag the headline median from $240 down to $234 and produce a misleading 10.6-times DR spread built on a missing-data bucket rather than on pricing.
- Known sampling limit: the market crawl excluded domains showing under 500 SEMrush visitors before prices were collected. That makes the under-500 traffic band a partial and upward-biased sample, and it means this study says nothing reliable about the very cheapest end of the market. Every band from 500 visitors upward is a complete sample of what we can see.
- Niche: the site’s primary category. Thresholds are stated on each chart: 2,000 or more offers for the index-wide niche chart, 200 or more inside the fixed slice, and 60 or more for our catalog-only figures.
- Regulated pricing: compares each site’s regulated rate to that same site’s standard rate, so the premium is like-for-like rather than a comparison across different sites.
- Same-domain comparison: only domains carrying a priced guest post offer from two or more distinct marketplaces, 65,340 of them, with the ratio taken between the highest and lowest offer on each.
Why our own listings are in the index
We are one of the fifteen marketplaces measured here, so our 5,873 priced listings sit inside every index figure rather than beside them. A price index that leaves out one of its own constituents is not an index, it is a comparison dressed up as one.
Two things are worth knowing about what that does. First, it barely moves anything: our listings are 3.2% of the pool, and adding them shifts the median guest post from $246 to $240, the mean from $655 to $640, and the share of offers below $361 from 62.1% to 63.1%. Second, the direction runs against us. Including our prices makes the index look slightly cheaper, which narrows the gap we could otherwise claim.
Where we do appear separately, the text says so. The stratified table in section one lists PRWiz as its own row so you can see us against the other fourteen on identical filters, and a handful of measures come from our catalog alone because the market crawl does not carry those fields: the regulated-niche premiums in section 08 and the permanent-versus-rented comparison in section 09. Both are labelled at the point of use.
| Index guest post figures | Without PRWiz | As published |
|---|---|---|
| Offers analysed | 169,933 | 175,556 |
| Median | $246 | $240 |
| Middle half | $104 to $574 | $103 to $560 |
| Mean | $655 | $640 |
| Share below $361 | 62.1% | 63.1% |
What we deliberately did not do
- No individual domain, publisher or vendor is identified. Marketplaces are named because their prices are publicly advertised. Their publishers are not.
- No affiliate or referral links to any marketplace named here appear anywhere on this page.
- We did not exclude marketplaces that undercut us, and we did not put ourselves at the top of the table. We are twelfth of fourteen on raw guest post medians and the table says so.
- Freshness: both datasets are refreshed on a rolling basis rather than continuously, so treat every figure as a periodically updated snapshot.
If you want to check any of it, the marketplace is free to browse and the filters are the same ones I used.